
Key Findings: BTC Technical Analysis
- Bitcoin failed to exceed the minor resistance at $70K after the price broke the trendline support on the daily price chart.
- The current bearish momentum is set to get stranger as the price moved below the 50-EMA support at $66,914.
- Technical indications suggest that prices are likely to drop more before the bullish rally can resume.
Bitcoin Technical Analysis – BTC/USD Daily Chart
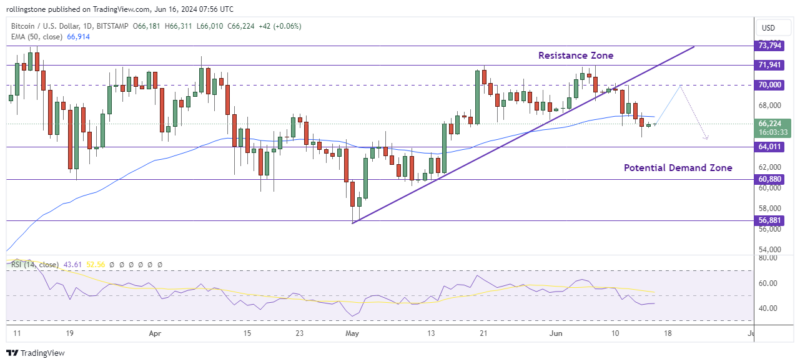
Due to modest withdrawals from the US Federal Reserve’s (Fed) and US spot ETFs’ decision to maintain a hawkish interest-rate stance despite decreasing inflation, the price of bitcoin (BTC) appears to be headed for a gentle decline this week. Technical data indicates that BTC may have a short-term pullback of an additional 5%, before continuing its upward trajectory.
BTC may have a short-to-mid-term downside correction of 5% within its current trading price of $66,632 in the next days, hitting the midpoint of the price discrepancy between $64,011 and $60,880.
Furthermore, if Bitcoin breaks and closes beneath the daily support at $60,800, it may undermine any bullish outlook, resulting in a 4% drop to its weekly support level of $56,881.
Key Findings: ETH Technical Analysis
- Ethereum is yet to decide on the upcoming market trend as the price action reflects indecision on the daily price chart.
- The price might return to the recent consolidation range if the support at $3,506 remains valid.
- A bearish breakout below the current resistance will initiate a solid downtrend movement targeting the long-term support at $3,024.
Ethereum Technical Analysis – ETH/USD Daily Chart
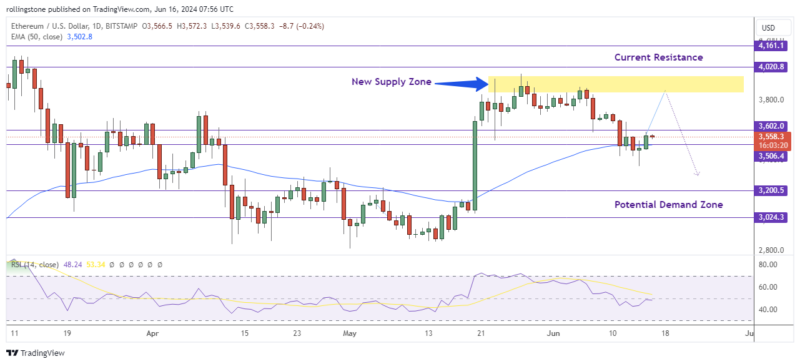
The price of Ethereum (ETH) fell by over 1.4% on Friday, failing to post any gains. This comes after a prominent BlackRock executive recently stated that future tokenization initiatives from established market players will reside on Ethereum.
Since Ethereum has not yet recovered from the losses it sustained during the previous day, it is currently trading at $3,417 on Friday.
As mentioned in prior research, traders anticipate increased volatility in the upcoming months, but ETH might not undergo any significant price activity in the near term.
So, it is expected that ETH will continue to fluctuate in a range-bound manner over the next few weeks, between the $3,506 and $3,730 price levels. Should the cryptocurrency market witness an unforeseen surge in optimism, a subsequent advance toward testing the $4,020 barrier is anticipated.

Affiliate link — we may earn a commission.