Reddit mentioned Qtum 15 times in the 30 days to 20 October 2026, across 4 of the communities we track. All of them were scored for sentiment: 73% read bullish, 0% bearish and 27% neither. Reddit data updated 20 October 2026.
This price chart is drawn by TradingView, from their own data, in an embed loaded from their servers. We hold too few licensed daily closes of our own for QTUM to draw a line in its place.
Supply & valuation
Circulating supply can't be independently verified for this asset; this valuation uses total on-chain supply. Why we label it this way
This asset's circulating supply (and any valuation computed from it) is carried from a named source rather than our own chain read: Powered by CoinStats.
Qtum · crowd attention × price
Share ↗
Day18 Oct 2026
Before our first record — not zero
Qtum drew 15 Reddit mentions over the 30 days to 20 October 2026
Reddit stayed net bullish on Qtum every day of this window we could measure, and its close rose from $0.7167 to $0.8596
This chart in words
The chart plots daily Reddit mentions of Qtum over the 30 days to 20 October 2026: 15 in total, busiest on 3 October with 3, and 1 on the last day counted. The line is the last price recorded each day over the same window — these venues never close — from $0.9885 on 21 September to $0.8596 on 20 October.
The chart plots daily Reddit mentions of Qtum over the 90 days to 20 October 2026: 72 in total, busiest on 13 August with 5, and 1 on the last day counted. We hold no record of Qtum before 29 July 2026, so the dashed lead-in marks days this chart cannot describe: neither a run of zeroes nor a claim about when we started counting. The line is the last price recorded each day over the same window — these venues never close — from $0.7167 on 23 July to $0.8596 on 20 October. Sentiment — the bullish share of the mentions that took a side, where the chart's dashed rule marks the 50% at which bullish and bearish are even — ran from 86% bullish to 100% bullish over the 29 days that carried enough mentions to measure. 53 days either fell under the 5-mention floor or carried no bullish or bearish mention at all, and so carry no sentiment point.
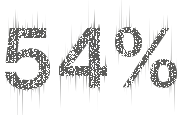
Crowd sentiment on Qtum · 30d
 bullish
 bullish
Qtum reads 19 points more bullish than overall market sentiment. Same measure; same 30-day window.
Where Qtum is discussed
(30d)Moves with Qtum
co-mention r · 31 obsTickers whose daily Reddit volume rose and fell with Qtum's. Co-discussion, not price.
How closely daily Reddit mention counts rose and fell together over the last 30 days (31 daily observations) · Method
QTUM — frequently asked questions
What is Qtum's supply?
Qtum has a circulating supply of 106.1M QTUM and a total supply of 107.8M QTUM. This asset's supply can't be read from the chain in a single call, so the circulating figure is data powered by CoinStats rather than our own chain read — labelled as such on this page.
How is the QTUM price here computed?
The QTUM price on this page is market data powered by CoinStats. This asset has no qualifying on-chain venue for a direct read, so we carry the figure from a named, attributed aggregator instead of computing it ourselves — labelled as such on this page. The full method and labels are documented on our methodology page.
Does Qtum have a market cap?
We don't label a market cap for Qtum because its circulating supply can't be independently verified. Instead this page shows a total-supply valuation of $92.7M — the price times its total supply, data powered by CoinStats — labelled as exactly that.
What chain does Qtum run on?
Qtum runs on its own blockchain — QTUM is that chain's native coin, not a token issued on another network.
Answers are generated from the live figures on this page — market data powered by CoinStats — and update as the data does.
Sources
- CoinStatsPowered by CoinStats · daily snapshot
- RedditReddit ingest across the tracked finance subreddits
- TradingViewthe price chart widget, drawn by TradingView from their own data