
Key Findings: BTC Technical Analysis
- BTC broke the $67,000 barrier on Friday with a 10% increase in just seven days.
- The daily price chart signals an upside momentum following the bullish breakout of 50-EMA at $63,892.
- A stable closing above $67,000 would suggest a change in the Bitcoin market structure.
Bitcoin Technical Analysis – BTC/USD Daily Chart
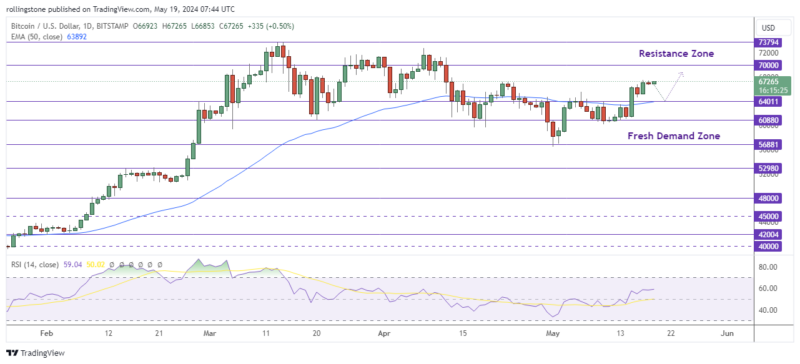
With gains of up to 10% throughout the last seven days, bitcoin is currently trading within a bullish momentum. It has increased by 2.2% during the past day, which is quite an accomplishment even for the cryptocurrency king. The global cryptocurrency market capitalization has increased by 2.8% reaching $2.43 trillion as altcoins have followed suit.
The bitcoin price has surged past $67,000 following a string of higher highs in a single day. Following a series of lower highs from April 8 to May 9, Bitcoin has crossed the $65,500 crucial mark. A confirmation of a daily price candle close above $67,000 would validate a shift in the market’s structure.
It represents a change for Bitcoin from a range to an on-trend market. Take note of the RSI consistently higher lows, which indicate that buyer momentum is still increasing.
A stable close above $67,206 in the one-day time frame would set the pace for a continuation of the climb toward the $70,000 psychological level. In a highly bullish case, BTC could flip this threshold into a support floor and use it as the jumping-off point to target the $73,777 all-time high.
See Related: Bitcoin And Ethereum Technical Analysis: BTC Moves Below $64K Following An Unsuccessful Test of The 50-EMA
Key Findings: ETH Technical Analysis
- Ethereum gains 5% after Vitalik Buterin addresses community concerns in the wake of Coinbase’s ETH ETF forecast.
- The price is now testing a solid resistance at the 50-EMA near $3,125.
- ETH/USD might retest the $3.5K level if the price can break the immediate resistance at $3.2K.
Ethereum Technical Analysis – ETH/USD Daily Chart
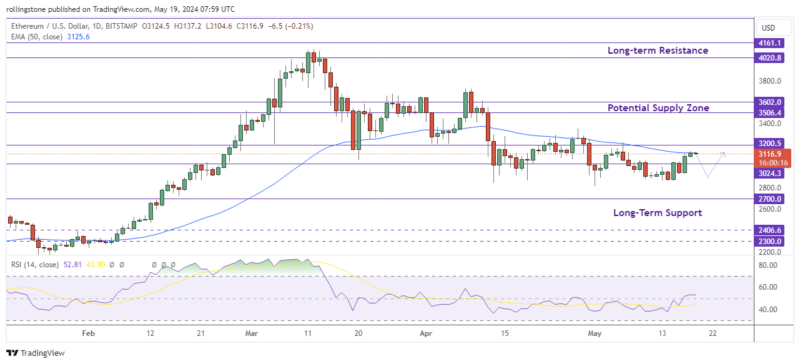
Ethereum broke above the $3,103 hurdle on Friday, posting a 5% gain. The increase comes after assets in the cryptocurrency market have generally appreciated. But on the last day, Ethereum significantly beat Bitcoin when several community members pointed out that the ETH/BTC rate was almost at its lowest.
ETH open interest has surged by 6.6% within the last day due to the recent surge in ETH value. As a result of the resurgence of investor’s interest in ETH, there may be fewer sideways movements in the near future.
If there is a surge in confidence, ETH might try to break through the $3,125 resistance and, if it does, go above $3,200. A solid bullish breakout of this level might push the price above $3,500 next week.