
Key Findings: BTC Technical Analysis
- Bitcoin rejects the resistance at $71,941 for the second time since May 21.
- The 50-EMA at $66,846 offers solid support for the current consolidation range.
- A break below the 50-EMA support will validate the double-top pattern formed on the daily price chart.
Bitcoin Technical Analysis – BTC/USD Daily Chart
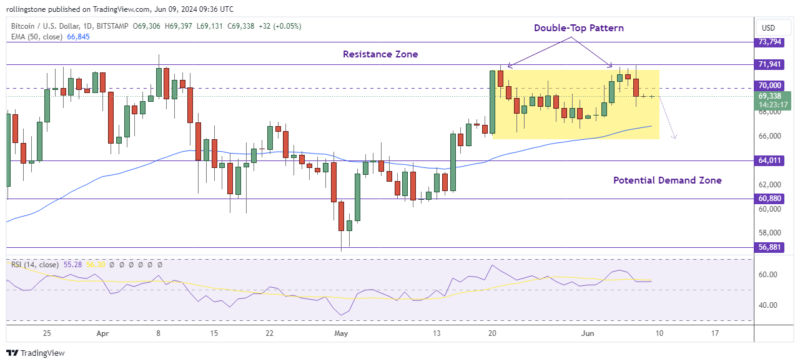
According to the daily bitcoin price chart, the bearish market structure is still in place even with the recent surge in the price. A higher high will be produced by a breakout right above the $71,958 swing high on May 21. This will indicate that the bulls are trying to mount a comeback. In light of such a development, the trailblazing cryptocurrency may try to reach its all-time high of $73,795.
However, a 7% rally to the next significant psychological level as well as a new ATH of $80,0000 would be possible if bulls are able to reverse the Momentum Indicator’s breakthrough level of $74,780.
The short-term uptrend would be invalidated if there was a market-wide collapse that caused the BTC price to drop to a lower low below $67,151. This can lead to a shift in the direction of the $60K psychological level.
The bullish prognosis will be invalidated if buyers are unable to hold this crucial level, which would result in the creation of a new lower low on the daily timeframe. A sell-off that might drive Bitcoin to the middle of the $60,880 to $64,011 gap, could be sparked by such a negative move.
Key Findings: ETH Technical Analysis
- Ethereum failed to break the critical resistance at $4,020 despite the recent bullish trend.
- The price keeps consolidating inside the daily price candle formed on May 23.
- The support at $3.5K might play a critical deciding level for the upcoming market trend this week.
Ethereum Technical Analysis – ETH/USD Daily Chart
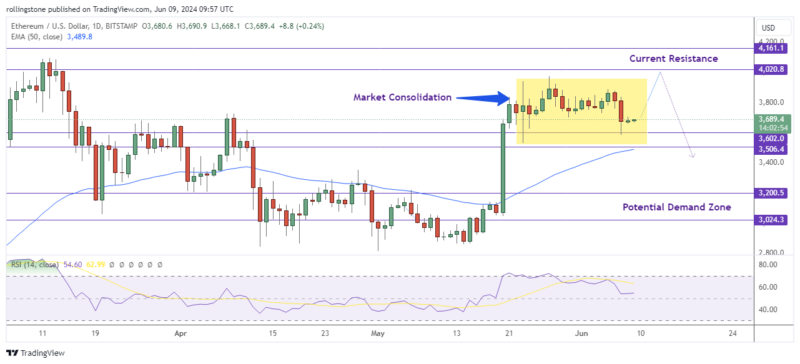
Due to heightened pessimism in the cryptocurrency market, the ETH/USD has lost momentum after around three weeks of holding above its key support level of $3,506. Over the last seven days, it has corrected by 2.26% and 3.5%, respectively.
The Relative Strength Index (RSI) records a steep decline toward the midpoint after failing to break above the overbought area. Additionally, the average displays a bearish curve, indicating a poor prognosis for the price of Ethereum going forward.
The bulls will regain momentum and get ready to test the ETH currency price’s upper resistance level of $4,100 in the next weeks if the market keeps the price above the $3.5K -$3.6K support zone. On the other hand, the market might retest $3,024 if the bears maintain their dominance.

Affiliate link — we may earn a commission.