Aayush Jindal, crypto journalist and technical analyst at NewsBTC, has posted his technical view on the latest changes in Cardano price actions. According to his report, ADA shows no sign of a bullish reversal. Instead, the price might move on within the current bearish trend and hit the critical support around $0.22.
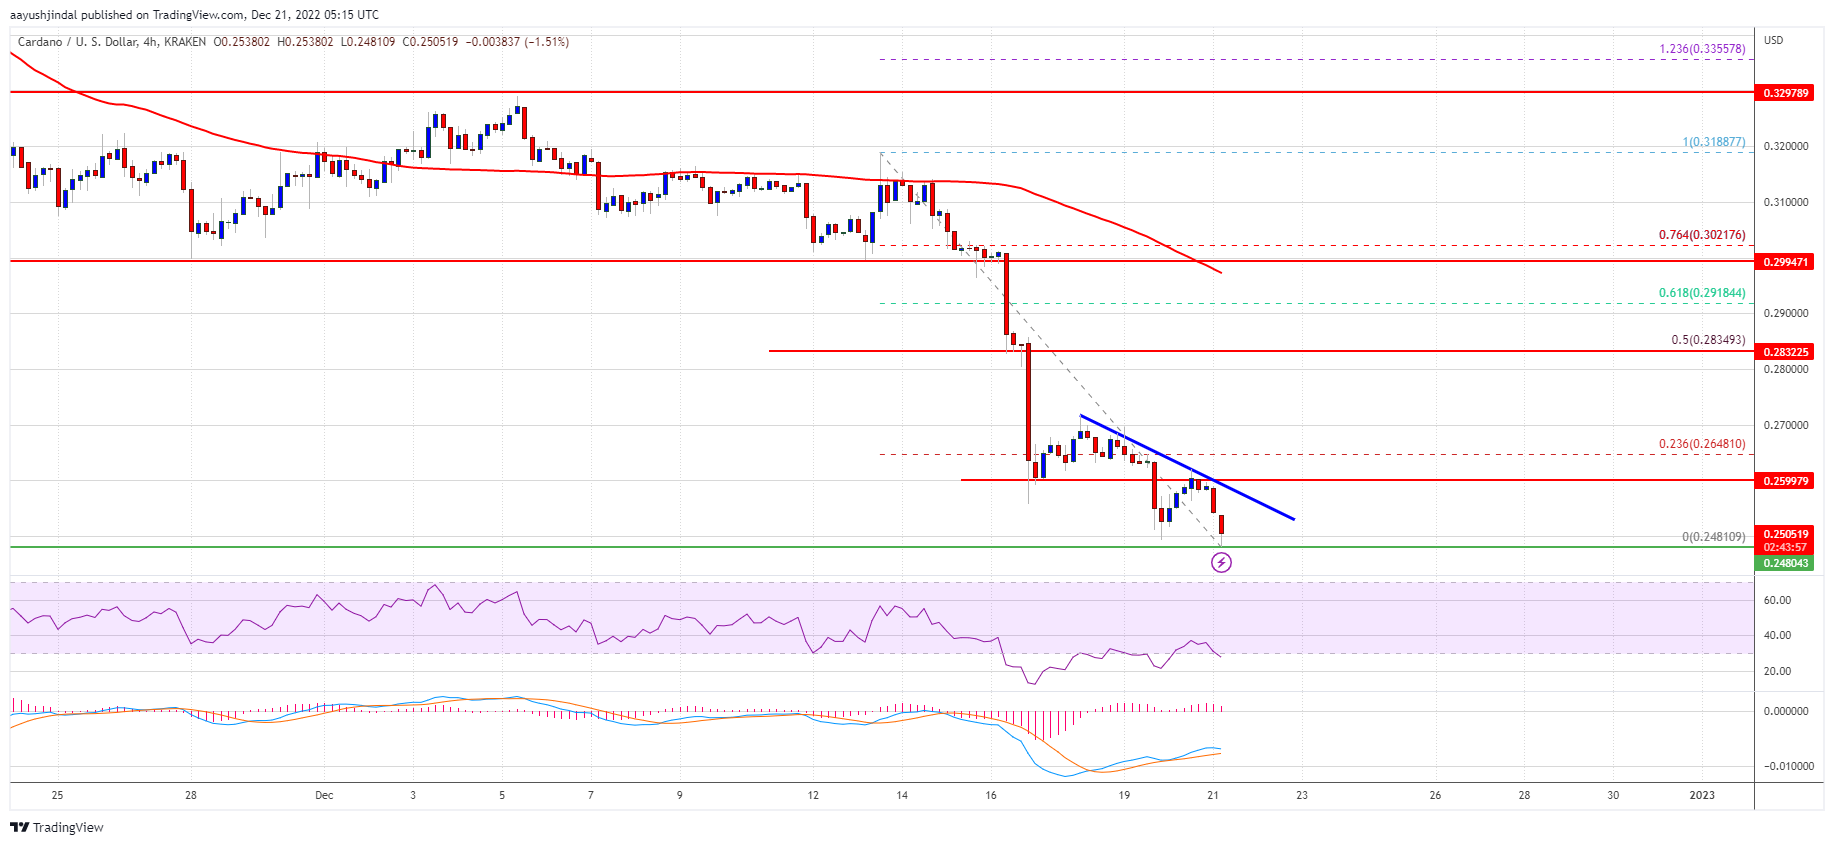
- Cardano’s price has steadily fallen from the $0.320 barrier over the last three days. Eventually, the price broke the support at $0.280 and is yet to show a sign of recovery anytime soon.
- The decline accelerated below $0.265 and the 100 SMA (H4 chart). The ADA price even dropped below the support at $0.250, trading as low as $0.2481. Unlike Bitcoin and Ethereum, Cardano is now displaying a significant number of bearish indications near the $0.250 level.
- The primary resistance is currently forming near $0.2840. It corresponds to the 50% Fibonacci retracement of the decline from $0.3188 to $0.2481. If the price exceeds the resistances at $0.280 and $0.284, it could begin a strong rise. In the aforementioned scenario, the price could steadily rise toward $0.32.
- The next support awaits near $0.245. A break below $0.245 could signal the start of a new downturn toward $0.220 in the upcoming weeks. The ultimate support lies near $0.200.
See Related: In One Month 400 Projects And 100k Wallets Have Appeared On Cardano