
Key Findings: BTC Technical Analysis
- Bitcoin price is back to the critical resistance at $28,065 after five days of consolidation.
- The BTC fractal is still intact, keeping the price from revisiting the psychological threshold of $30,000.
- If there isn’t enough demand near $28K, BTC may drop to $25,000 or less.
Bitcoin Technical Analysis
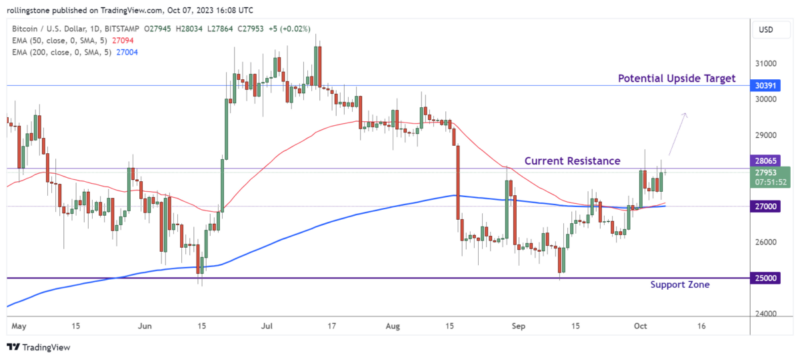
The daily chart of the price of Bitcoin (BTC) indicates no directional bias and a range of $27,600. Since there are pockets of liquidity in both directions, traders are left speculating as to where the BTC will move next.
The price fractal for bitcoin (BTC) has been rejected at the $28,000 level of the 200-day EMA and is currently experiencing a significant sell-off. The candlestick for October 2 consequently closed below it. Since then, BTC has been trading between $27K and $28K while consolidating in a maximum of $1,300 range.
Technically, the price has managed to hold above 50 and 200 EMA, and these two moving averages already plotted a bullish crossover, suggesting a potential bullish breakout of the $28K resistance. In such a case, Bitcoin will get the opportunity once again to exceed the $30K level to revive the bullish trend.
Key Findings: ETH Technical Analysis
- Ethereum keeps trading below the 50 and 200 EMA levels.
- The ETH/USD daily price chart has printed a head and shoulder pattern.
- ETH failing to exceed the current resistance at $1,663 may result in a further bearish move targeting $1,532.
Ethereum Technical Analysis
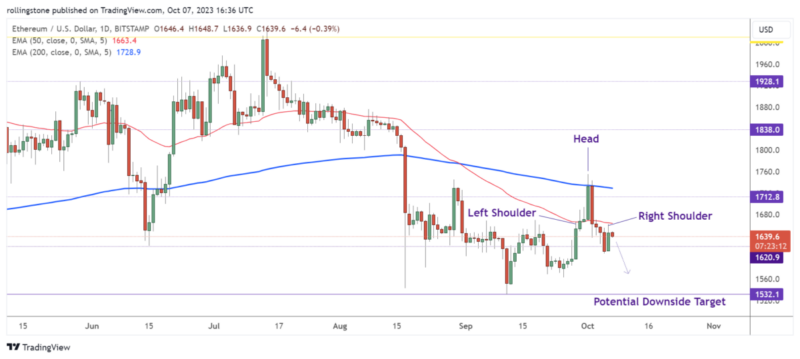
Technical analysis of the Ethereum daily chart suggests a probable recovery toward the 50 EMA, which is located close to $1,663.
Looking more generally, though, we can see that ETH/USD has been forming an ascending triangle, a negative continuation pattern.
Consequently, a collapse below the lower trendline of the triangle increases the likelihood that the price would drop by as much to the pattern’s maximal height. In this scenario, depending on the breakdown point, ETH’s price in October 2023 might fall to $1,465 or $1,560.
Ethereum’s price can drop towards the demand area between the $1,600 and $1,532 order block if the $1,663 barrier is rejected. The bullish argument would be refuted by a break and move below this zone’s midline at $1,585, which may push the Proof-of-Stake token down to the $1.5K area.

Affiliate link — we may earn a commission.