
Key Findings: BTC Technical Analysis
- Bitcoin price finds support at 21 EMA ($35,593) on the daily price chart.
- The current price consolidation range may end with a bullish breakout following the solid uptrend condition.
- BTC can enter the fresh supply zone above $40K if the price sustains above $35K this week.
Bitcoin Technical Analysis – BTC Daily Price Chart
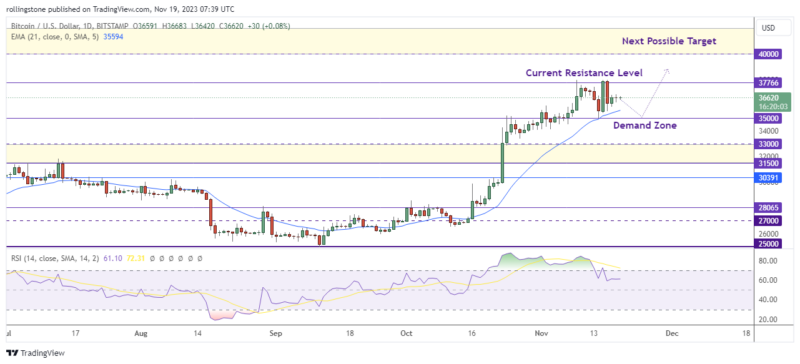
As the market waits for the next big move, Bitcoin (BTC), which has recently failed to break above $37,776, is still comfortably above the $35K support zone.
Interestingly, most market players seem to agree that Bitcoin is about to rise and reach a fresh all-time high. A possible ETF approval and the upcoming halving event of next year are the primary sources of this optimism.
BTC/USD failing to exceed the current resistance of around $37.7K doesn’t mean it has already lost the bullish momentum. The price respected the 21 EMA support and denied breaking below the $35K level, indicating Bitcoin is still in pursuit of hitting the next potential upside target at $40K.
However, the relative strength index (RSI) dropped below 70, which indicates the price is currently in a corrective mode. So, traders will likely wait for another pullback near the current support at $35K to enter long.
Alternatively, a bullish breakout at $37.7K may provide another opportunity for buyers to rejoin the strong upside rally targeting the $40,000 level as a potential take-profit zone.
Read Related: Bitcoin, Ethereum Technical Analysis
Key Findings: ETH Technical Analysis
- Ethereum price dived below the $2K level but is still closing inside the large bullish mother bar plotted on November 9th.
- The price refused to break the current support at $1,928 for three consecutive days.
- We may see ETH plotting another bullish move, targeting the $2,300 level if it can sustain above the 21 EMA support of around $1,933.
Ethereum Technical Analysis – ETH Daily Price Chart
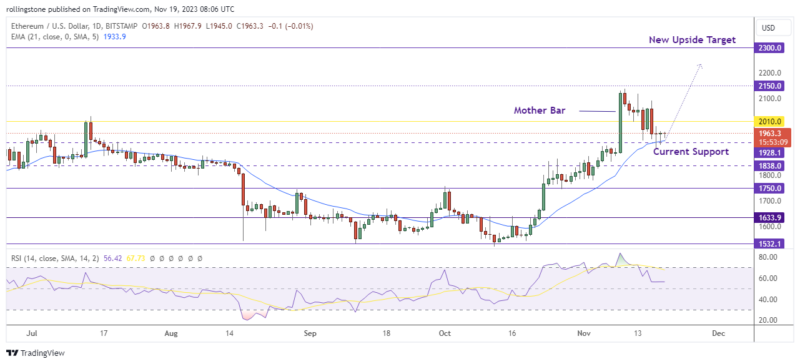
Ethereum (ETH) is currently at a crossroads in the cryptocurrency market, driven by Fidelity and BlackRock’s latest Ethereum ETF filings. The price is currently hovering between critical support at $1,928 and resistance at $2,010.
According to the daily price chart, ETH also failed to break the 21 EMA support near $1,934, which signals the existence of a solid bullish momentum. However, we may see a sluggish price movement until the RSi hits the 50-level (currently at 56.50).
Technically, the price failing to break below the $1,928 support level signals ETH/USD may break the current resistance at $2,150 and keep cruising toward the $2,300 level as the next potential upside target.

Affiliate link — we may earn a commission.