
Key Findings: BTC Technical Analysis
- Bitcoin tests critical resistance at $60,880 after breaking below the 50-EMA support ($63,928).
- Despite the solid bearish momentum, the price can still pull back near the current resistance at $64,011.
- If BTC decides to print a fresh lower low, the immediate support at $56,881 will be our next potential downside target.
Bitcoin Technical Analysis – BTC Daily Chart
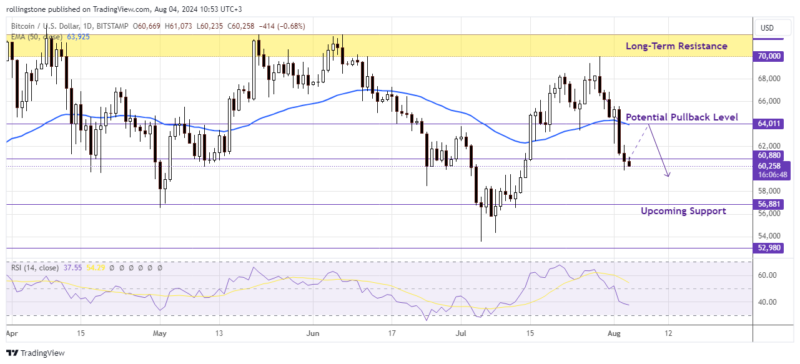
Bitcoin could go below the crucial $60k support level. A decline below this threshold might trigger a widespread sell-off in the derivatives industry.
The price has been declining on the daily chart ever since it formed a double-top structure below the $70K resistance level. The price is testing the support at $60K and has also fallen below the 50-EMA resistance.
Should it also lose its hold on the price, the market is likely to drop much more precipitously, possibly down to $56,881. The momentum suggests that the negative trend may continue, as the RSI is also displaying levels below 50%.
See Related: Bitcoin And Ethereum Price Prediction After The US SEC Intensified Its Clampdown On Crypto Staking
Key Findings: ETH Technical Analysis
- Ethereum plotted a strong bearish rally after the price failed to sustain above the critical support at $3,296.
- The daily chart shows no sign of a bullish reversal as the price breaks below the $3K mark.
- ETH might pull back near $3,024 before heading back to upcoming supports near $2,815 and $2,700.
Ethereum Technical Analysis – ETH Daily Chart
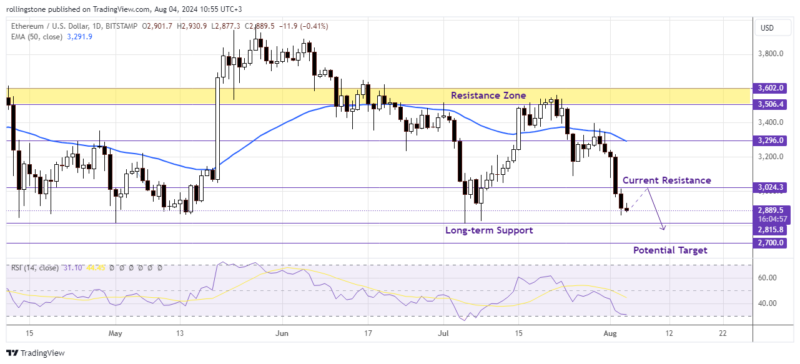
Ethereum set a solid bearish trend setup after it plotted multiple bearish pin bars below the 50-EMA, creating a lower high that resulted in a downside rally from the resistance near $3,296.
Recently the price broke the critical support at $3,024 and dragged the price to a further downside target near $2,815.
The RSI at 31.94 signals the price stepped inside the oversold zone already but the market is still under a strong bearish trend. Therefore, sellers may wait for a potential pullback before adding more short positions in favor of the current downside momentum.
According to the current bearish momentum, ETH might retrace to the immediate resistance near the $3K level and rejoin the downtrend targeting the ultimate support at $2,700.

Affiliate link — we may earn a commission.